Make Sense of Your Certificate of Analysis
Craft Brewing is both an art and a science, but you needn’t be a chemist to appreciate your malt supplier’s certificate of analysis (COA). Don’t be overwhelmed by the technical analysis contained in a COA; use it. Make sense of it first, though — at least those parts that enable you to remain consistent in achieving the quality and efficiency of your brewing. The purpose of this article is to look at information found on a COA and how it relates to the outcome of the brewing process.
Sieve Analysis and Assortment Percentages
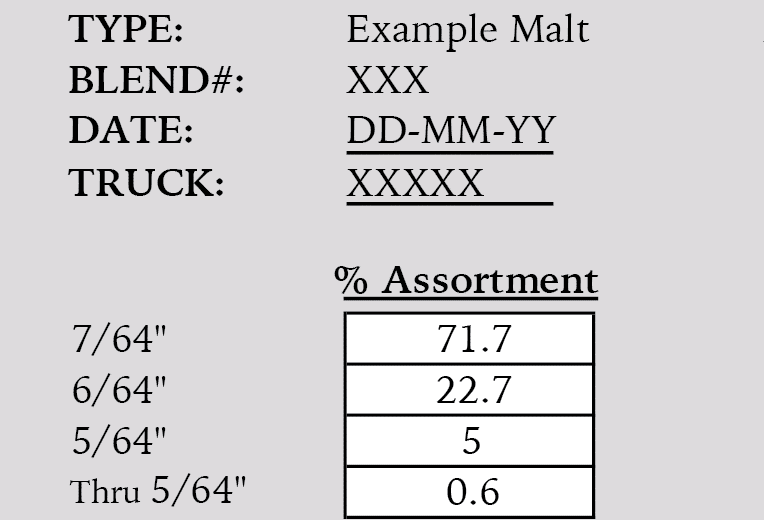
Because roller mill gaps are set based on the mean kernel size, the consistency in kernel size matters. The COA accompanying your malt will contain a percentage breakdown of kernel sizes. Plump kernels provide more extract and the malt sieve analysis indicates the ratio of plump kernels to the thinner ones. An assortment analysis that demonstrates a combined total value of 90 percent or more for the 7/64-inch and the 6/64-inch kernels indicates a high ratio of plump kernels and will yield a good extract.
Friability
Friability describes the tendency of a solid substance to break into smaller pieces under duress or contact. Friable barley grain is one that crushes cleanly and crisply. Lautering performance can be reasonably predicted based on the malted barley’s friability value, and it also indicates the degree of malt modification. Too little modification during the malting process could lead to a less than ideal mash conversion. A good friability value for Pilsen malt is 82 percent or greater with base malts typically averaging slightly higher.
Extract Percentages and F/C Difference
A variety of factors can contribute to the amount of extract that a brewer will obtain from a given malt. The Certificate of Analysis (COA) will provide a malt extract analysis that indicates the percentages derived from fine (F) grind and coarse (C) grind samples. Typical values are between 79 and 84 percent for fine grind and 77 to 83 percent for a coarse grind.
The COA also provides a percentage for the F/C difference. F/C difference refers to a calculated value by subtracting the extract percentage of the coarse grind sample from that of the fine grind. The difference between the two extract values provides a useful indication of the homogeneity of the malt. A typical F/C difference value is between 0.5 and 1.5 percent. A larger value demonstrates a lesser degree of uniformity in the malt, which is undesirable.
Soluble to Total (S/T) Ratio
The S/T ratio compares the amount of soluble (S) protein to the total (T) amount. S/T ratio also demonstrates the amount of insoluble protein in the malt. Low S/T ratio values predict a reduction in foam and color formation but can result in a more full-bodied beer. Low values also slow the wort separation. High S/T values lean towards producing a thinner beer with less mouthfeel. A minimum S/T ratio of 30 percent is necessary to prevent any issues in the lautering process.
Calculating total protein percentage is done by multiplying the total nitrogen percentage by 6.25. Lower protein percentages predict a greater extract yield, while higher levels indicate an increased amount of key maltose and amino acid producing enzymes.
Free Amino Nitrogen (FAN) and Moisture
Insufficient free amino nitrogen (FAN) causes incomplete or slow fermentation and inhibits yeast growth. Yeast and other microbes can absorb and convert excessive FAN into compounds contributing to undesirable flavors. Too much FAN will also affect the wort boil and increase color formation. FAN is measured using milligrams per liter, with 130mg/L or less indicating an insufficient amount and 250mg/L marking the beginning of the excessive range.
The percentage of moisture in the malt indicates the success of the kilning process. High moisture rates, which are values greater than nine percent, can cause the malt not to store well and can also produce low extract yields. Other COA results can be out of range with high moisture levels. A typical moisture value for a two-row base malt is between 4.0 and 4.9 percent.
Viscosity and Beta Glucan
Wort viscosity has a direct relationship with potential haze issues and wort run-off time. It also indicates the combined amount of pentosans, proteins and beta glucans. The conventional analysis is between 1.48 and 1.52.
Beta Glucan, or BG, influences wort viscosity. Levels higher than 140 mg/L predict a more viscous wort and potential difficulties in the lautering or filtration process. A high BG level can also promote the formation of precipitates and hazes.
The Next Step
You know your brewing and your malt supplier knows malting; maintaining communication is an excellent way to troubleshoot brewing issues. Arguments can be made that the US beer market is the most diverse of all and Great Western Malting has remained focused and fully committed to making the highest quality malt designed to be the heart of your craft.


